How to Track Percent Complete
When you are trying to calculate percentage complete in a Gantt chart, you need to take into account various different figures, and get lots of information from other people. Or do you? There are simple ways to track percent complete on your project, so you know what to input into your software.
In this article we’ll look at 3 methods to track percent complete.
What is Percent Complete?
It’s a way to track project progress against the project schedule – quite an important part of how to manage a project.
Percent complete on a project refers to how far through you are for any given task (or the project overall). Consider it an indicator of project progress.
In the image below, you’ll see that % complete is represented by the color green. The blue section of the bar represents work not yet done. There’s also a column that gives you the % complete number.

If you have a project summary task, that will track the actual percentage for all the sub-tasks. It can be quite misleading, so if you are using it to communicate at a high level to senior stakeholders, I’d add some narrative to explain the current status.
Percent Complete in your project software
The percent complete method your software uses is down to whether it’s an enterprise tool that integrates with timesheets or not.
If your tool is integrated with a timesheet app, the percent complete of the task may increase automatically as your team members book time to the task. However, that might not be brilliantly accurate, depending on how good the team’s time tracking is.

In your software, there’s normally a column on the left-hand side of the Gantt chart that lets you manually enter percent complete in a field, and this is how I do it in tools that don’t integrate with timesheets.
But how do you know what to put in the percent complete field? Is it just a guess?
Well, that’s one way of doing it! Here are 3 ways of calculating percent complete on a project.
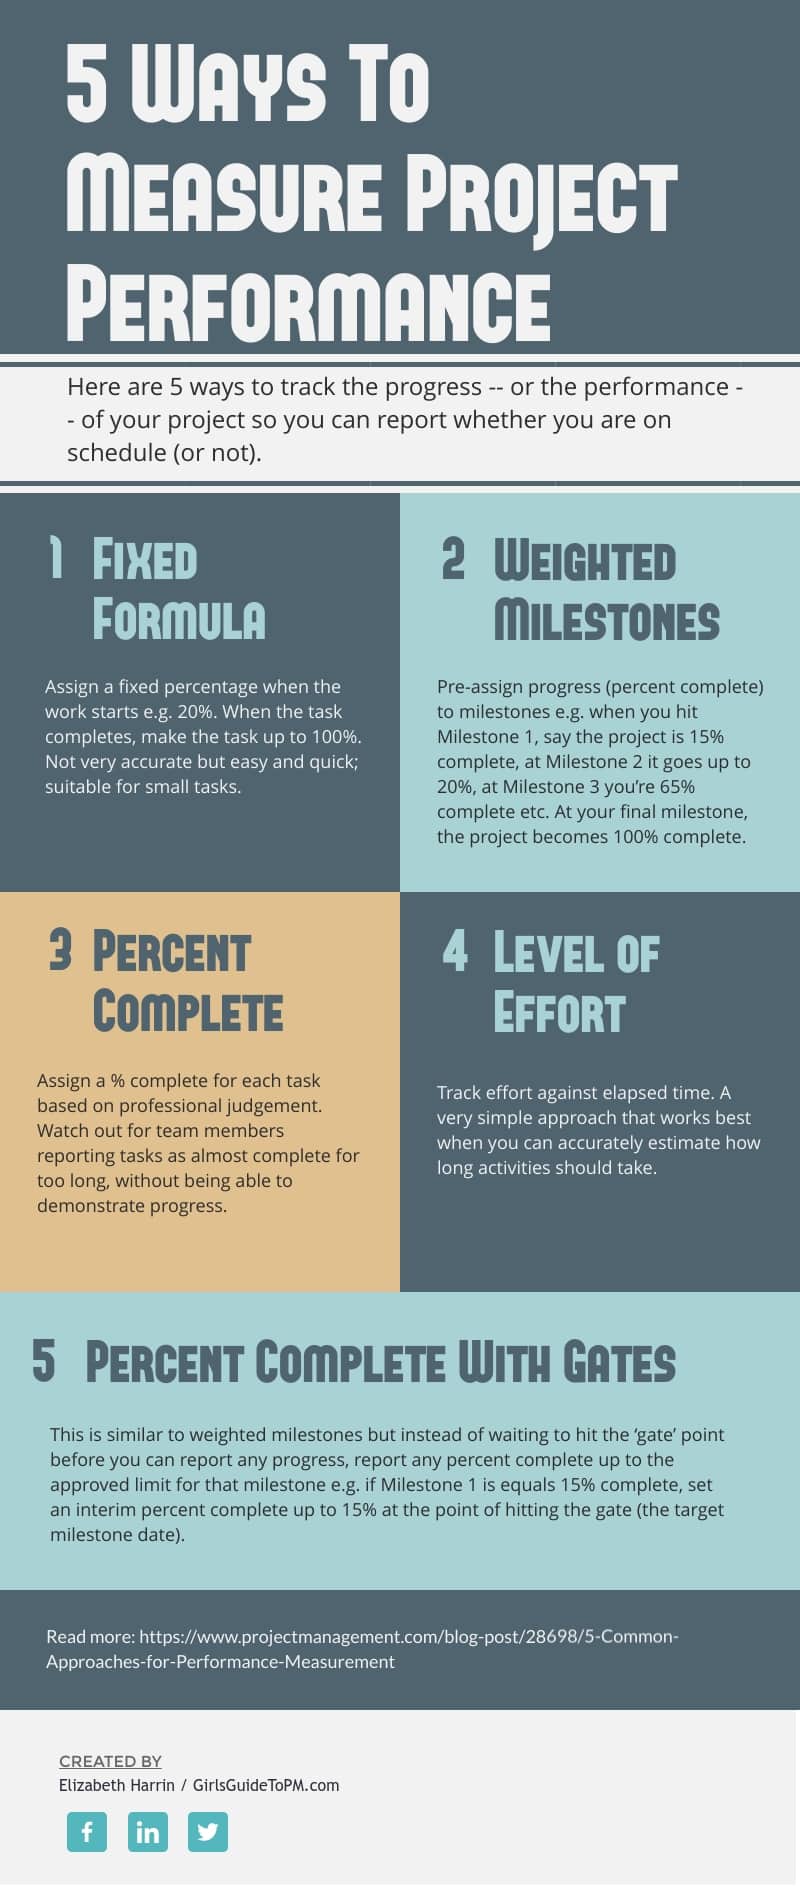
Percent Complete Tracking #1: Professional judgment
The first way to calculate percent complete for your project is to use your professional judgment or that of your team.
There is no percent complete formula here – you guess, estimate, or rely on the thought processes of your subject matter experts. Ask them how they rate progress on the task. They mentally compare the actual duration of the work done to date with the forecasted amount of work, and assess how close the task is to being done given that effort. They give you a number. Then you type it into the percent complete column.
This is the easiest option, as long as your team gives you the right answers!

Percent Complete Tracking #2: Weighted activities
This is a more complicated percent complete calculation to track progress, but it could be worth doing for longer tasks that are made up of several activities, or that have arbitrary points in them. For example:
- A week-long task that has a decision-making meeting halfway through the week
- A task to build 500 lines of code, that could be split into 2 chunks, each of 250 lines
- A testing activity made up of 20 tests, that could be split into 4 sections, each of 5 test scripts.
In these cases, you wouldn’t want to make the task smaller by splitting it down, but you know there is a point at which you could track progress. In the last task example, you would allocate % complete based on how many test scripts the team had got through.
- When 5 test scripts are completed, you allocate 25% complete
- When 10 test scripts are completed, you allocate 50% complete
- … and so on.
When your task can be easily sub-divided (but not in a way that would make you want to split the task up for the schedule) then you can allocate % complete based on a specific measure of how far through you are.
If your task doesn’t break down neatly in a numerical way (e.g. 10 test scripts = 50%) then you can allocate a % complete based on hitting an arbitrary point in the activity, for example a sign off meeting, or completing a document to the point that it has gone out for review but hasn’t yet been ratified by the whole team.
This method takes a lot of thinking and sometimes you’ll have to set your % complete targets before the task has started so that everyone has a common understanding of what’s being tracked and how it will be measured.
It’s a big overhead for what’s actually not that important in the vast majority of cases. Think carefully about whether it’s worth adding this level of formal granularity to your project tasks, or whether professional judgment is enough.
I have used this technique but it’s not something that is relevant to most of my projects. If it feels like a good fit for the way your team (and customer) wants to manage the work, then go for it.
Percent Complete Tracking #3: Arbitrary amounts
The final way of working out what to put in the percent complete column is by using an arbitrary, fixed figure.
For example: when a task begins, you give it 20%. When the task finishes, you make it up to 100%. The task would never be 25% or 90%. It could only ever be 0%, 20% or 100%.
This method of tracking gives you a percent complete that broadly reflects the current task progress for the purposes of scheduling, even though it’s inaccurate in real life.
It gives you enough of a steer to adequately manage the plan. It’s low stress. It’s easy. It’s useful if your team constantly give you incorrect percent complete figures and you no longer trust their judgment.

Do you need to track percent complete on projects?
Tracking percent complete is helpful for project managers. But it’s not essential. If you create a really simple schedule using my free Excel Gantt chart template, then it would be too much effort to color the cells to represent percent complete — I wouldn’t bother.
You can mark a task as complete, in progress, or not started, and add notes to summarize the current position.
Whether it’s worth tracking percentage complete on your project tasks depends on how robustly you need to track and report progress. If you feed progress data from tasks into your project dashboard, then you need it to be accurate.
The biggest problem with using percent complete as the way to assess progress on your project is that it is too often subjective. And just because you’ve managed to make loads of progress this week doesn’t mean that progress is steady.
Use your own professional judgment and choose a way to track progress that makes most sense to you. Learn more about categories of project management methods here.
Get a free Excel Gantt chart template in my project management template library. Access the library here to get access to the Gantt chart template and everything else!
Featured Software Partners
Create impressive timelines in just a few clicks with this plugin for PowerPoint. Try Office Timeline Pro+ free for 14 days. Create beautiful timelines and Gantt charts right in PowerPoint. Perfect for your next stakeholder presentation!
A great tool for organizing all our work, schedules and task allocations in the team. We wouldn't be without it!
Get fast & free advice from the experts at Crozdesk.com. Crozdesk's small team of dedicated Project Management software enthusiasts will compare 360+ products for you. Tell them your requirements and they'll match you with the right expert who can help.
- No Obligations
- Free Service
- Exclusive Discounts
- Expert Advice
- Minimal Time Commitment
- Get a Custom Comparison Report


