How to make a SIPOC diagram in all the tools (with PowerPoint template)
Process mapping creates value as it helps people understand the business context of the work they are doing. One tool to do this is the SIPOC diagram, which I use and I learned about on my Black Belt training.
Get a free PowerPoint SIPOC diagram template. Join the Project Management Resource Library to get the template and lots of other free project management templates, checklists, and guides.
Whether you want to understand how customers move through your small business, or mapping the processes used on a major civil engineering project, SIPOC is a visual process mapping tool that can help you see the big picture, identify the individuals involved and then plan more effectively – especially if you intend to change a process.
But what’s it all about? Read on…

What is a SIPOC diagram?
A SIPOC (say: sigh-pok) diagram is a simple way of recording an end-to-end business process.
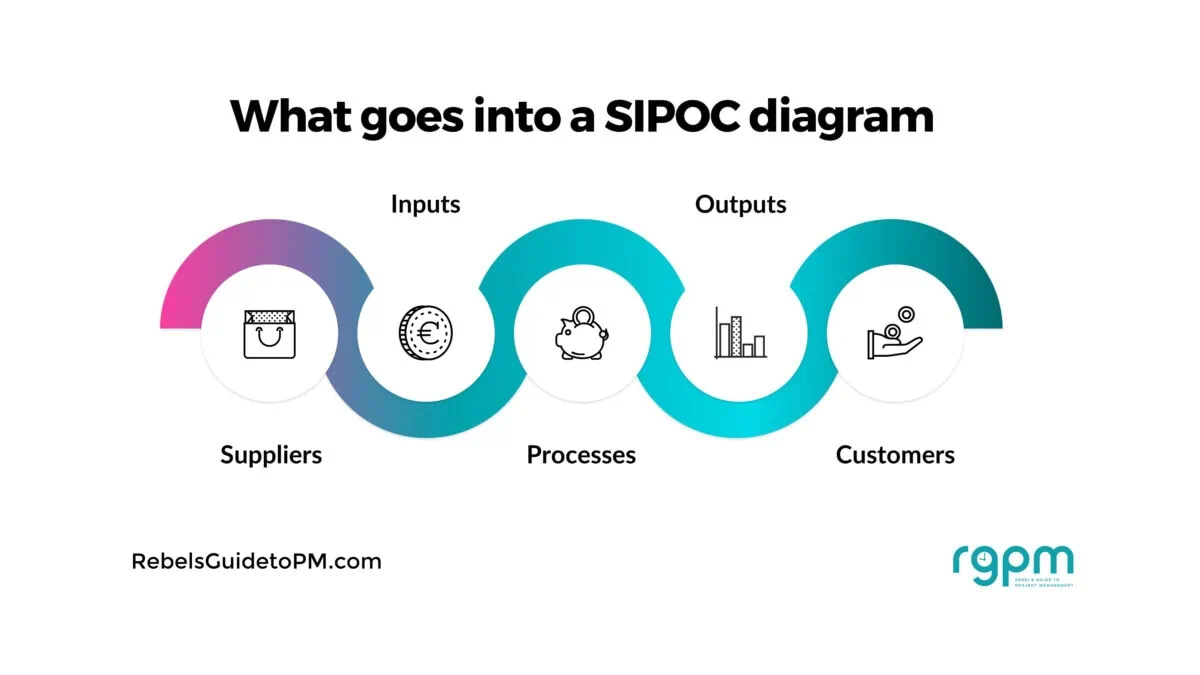
SIPOC diagrams have 5 steps and SIPOC stands for:
- Suppliers
- Inputs
- Process
- Outputs
- Customers
It’s a visual process mapping technique, and it is used to create clarity before digging into the deeper levels of the business process.
In other words, it’s a good way to get everyone on the same page before you start mapping the detail. You end up with a SIPOC diagram that shows the process at high level.

SIPOC example
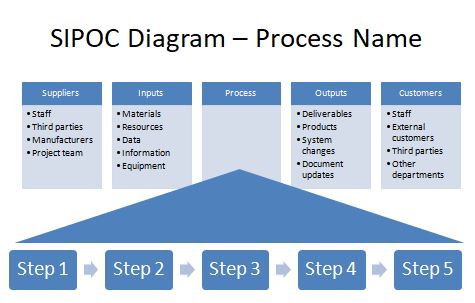
Here’s a totally generic SIPOC example that gives you an idea of what the end result should look like.

As you can see, it’s a visual tool that gives you the process (and more) on a page. Perfect for drawing out on a flip chart! Write the name of the process at the top.
If you don’t want to spend the time creating a fancy diagram, table format works just fine. Or you can get my SIPOC template which is an editable PowerPoint file to give you a headstart.
Let’s look at the different areas of the SIPOC template in more detail and how you can put one together for your own project.
1. Suppliers
Every process starts with the suppliers of the inputs: the people who provide the stuff that the process needs to get going.
Typical suppliers include your own staff (all the different departments involved) and customers. You may also have third-party suppliers providing other information.
For example, let’s use an example of the process to register an account on your company website. A supplier might be the web hosting company.
In project management terms, these are the people identified as your project stakeholders.
Action: Make a list of the people who supply information, services or other types of input to the process.
(For all these actions, work with your team. You might want to create a straw man sample to throw up on the screen during a meeting, but the final version needs to be done collaboratively.)
2. Inputs
Inputs are what are required by the process. These are transformed into what the customer needs during the process.
Typical inputs could be pieces of information, raw materials, or the technical environment. In the example of creating an account on a website, inputs would include credit card details, customer name, address, and so on.
Tip: Don’t forget the external inputs: things you need from other teams or other projects.
Action: Make a list of all the key inputs to this process.
3. Processes
At this step you define the high level process. By now you’ve got clear on what and who are helping this process happen. Now you have to plot out the five to seven major process steps.
These should be at a really high level. You’re not trying to map out the exact step-by-step flow here. It’s only to give a flavour of what is happening at the most basic level.
This would be your Level 1 process. It gives you the building blocks to create a more detailed process map or flow diagram later, which will have the level of detail required to show someone exactly what happens step-by-step.
The SIPOC process is more to ensure everyone is clear about the big picture and that you can easily identify what’s happening.
In our website registration process, the steps would be something like:
- Customer arrives at website
- Customer navigates to account page
- Customer enters details
- Account is created
- Email confirmation is issued to customer
Action: Record the high level steps of the process. This isn’t a detailed overview, so keep your mini-process map to around 5 items.
I’ll say it again: you don’t need much detail at this point! Keep it big picture but do include the entire process.
4. Outputs
This is exactly as you’d expect – what comes out of the process. Once your inputs have been transformed by the process, this is what you get at the end: the outputs of the process. Drop these into the appropriate column.
In our SIPOC example for the website build, if you register on a website, what the process produces is a new customer account, and maybe you’d want to identify that as a new marketing lead as well.
One of the process outputs for the customer would be the email notification, and perhaps a welcome email offering a discount off your products, for example.
Action: Complete your SIPOC template by making a list of the outputs of this process.
5. Customers
These are the key customers of the process. This could look like a similar list to the suppliers list that you put together at the beginning, or it might look significantly different.
Common customers on projects include staff in different departments, the end user (the customer on the street) and third party vendors who then take the output and do something else with it.
The customers of the website registration process would be your end user (the customer who has registered on the website) and the sales and marketing team who can take that customer data and use it for marketing purposes. There may be other people in the business who would use the information created in the process who would count as internal stakeholders.
Often, the people we think of as the customer are not the ‘true’ customer. Who is after our internal colleagues? How do we meet their customer expectations? Challenge the content for this section to make sure you are identifying all the relevant customers.
I like this step the best because it forces our team to think of the voice of the customer and to make sure that their experience gets the priority it deserves.
Action: Make a list of customers and add it to the SIPOC template.

Why use SIPOC?
You want to know why you should be using this powerful tool, beyond the fact that it gives you a visual representation of a process as a high-level overview? OK! Here are some (more) reasons why you should consider using SIPOC on your project.
- The SIPOC map is a good tool for creating understanding and understanding the scope and key elements of the process
- The SIPOC gives you a common language for talking about what the process does now and how you want it to change
- It forces you to think about the requirements of the customers, not just the requirements of the people who shout the loudest
- It’s a way to provide some focus and structure to a brainstorming session, especially if you don’t have much facilitation experience and need a hand working out how to actually get this project started.
You might ask why it’s important to do process mapping for a process you understand well, if you are about to change it. It is worth doing: because you can only appreciate the impact of a process change if you know what the process is in the first place.
That’s why plenty of projects start off with creating a high level process map, or at least reviewing the last time process mapping was done and ensuring that whatever business process flow was produced back then is still accurate for today’s project.
Then you can refer back to the diagram and create the relevant process documentation to support it.
SIPOC and Six Sigma
I was asked the other day if SIPOC is Lean or Six Sigma. It’s from the Six Sigma tool set.

I learned SIPOC on my Six Sigma training
It’s part of the Define phase in the DMAIC methodology and has become a much-used tool in industries like lean manufacturing. It’s perfect for continuous process improvement initiatives and any type of process review where you are looking for potential gaps in the way things are done.
Having said that, you don’t need to be a Six Sigma Black Belt to make use of the tool on any continuous improvement project.
How to create a SIPOC diagram…
A SIPOC diagram is supposed to be a creative, collaborative endeavor. Get all the team members involved, talking openly and bouncing around ideas. It should be a team effort to produce the chart, and if you get the relevant stakeholders to help, it will be packed with relevant information that will shape the next stage of the project.
The easiest way to create your process map is to work with your colleagues in a workshop-style setting. Grab your mindmapping software, start from a blank page (or a template) and start getting your ideas down. You can always edit them later.
…in PowerPoint
That’s easy! Just download my free template and customize it. Add in your brand colors and make it suit your needs.
PowerPoint is very flexible, and as a SIPOC diagram is a visual way of presenting information, slides work very well. You might have to resize information to get everything on the page.
Remember you can change your slide size if you want to make the canvas bigger (and don’t mind scrolling).
…in Excel/Google Sheets
Excel is not the easiest of tools to use for predominantly text-based content, but you can create 5 columns, one for each of the elements.
Give each column a heading, add shading to differentiate it from the other columns and then add in your text. For the process column, simply list out the steps within the column itself.
You can add an extra box at the bottom for notes if you need to.
…in Visio
If you’re lucky enough to have a charting tool, you might find there is a template — check any libraries called ‘workflow diagrams’ or use the search feature.
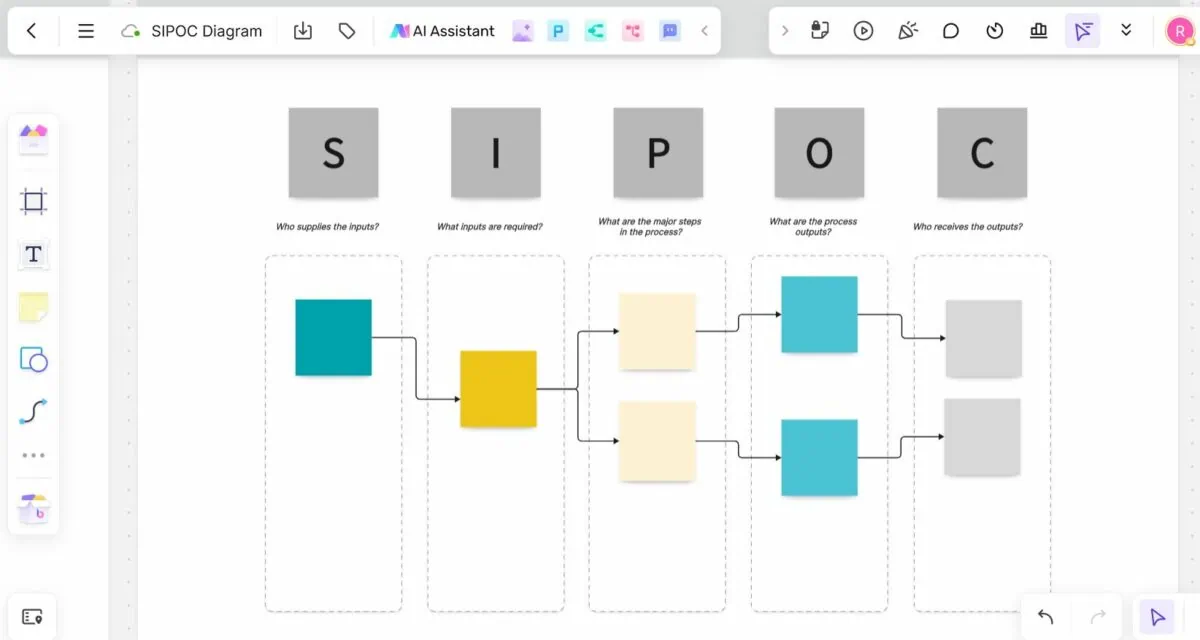
I use Boardmix, which is a bit like Visio in some respects, but more like Miro or other whiteboarding tools. It has a template, so you might find your charting tool does too.

If you don’t have a template pre-built for you, you’ll have to create the shapes and connectors on screen to get the look you want. I imagine that could be quite time-consuming, but no more so than doing the same work in PowerPoint.
…in Word
You can whip up a Word version easily.
Start with your page orientation as landscape. Add a title (as it’s hard to add text on afterwards if your table is the first thing on the page). Then add a 5-column table and enter your text.
You can use the drawing tools to add call-outs for your process steps if you don’t want to add them directly as text within the table, and that might make it look a bit more ‘visual’ too.

Limitations of SIPOC
The SIPOC model is only really good at drawing out the high level process. It’s not going to give you the detailed steps required to, say, put together a training manual or write a user guide.
And let’s not get on to complex processes. You really have to dumb it down or breakdown the process into sub-processes to get anything of value, and by the time you’ve done that, is the output really valuable at all?
This type of business process analysis is quite simplistic but it does act as a good starting point with key steps that help you move forward.
Could you see a value for this in your business?
Your next steps
- Hop over the Resource Library to grab your template
- Think about what project you could use this on (although if you’re already reading this article and you’ve got this far, you probably have one in mind)
- Make a draft version with what you know
- Gather the team to discuss and agree on the contents to gain consensus
