Expected Monetary Value (EMV): A Project Manager’s Guide
This blog is reader-supported. When you purchase something through an affiliate link on this site, I may earn some coffee money. Thanks! Learn more.
What is EMV?
EMV is a risk analysis tool that helps establish the contingency reserves for your project activities. It’s a statistical technique for quantifying risk. At the end of it, you get a decision tree that summarizes the financial impact of following a course of action.
Using expected monetary value allows you to calculate the profit and loss of an activity, whether that’s a whole project, or part of a project, taking into account different scenarios. The P&L of the outcome is the EMV.
Expected monetary value in decision theory is often used to choose between two options. You could use it to decide between more, but then I find the decision trees become messy and it’s a lot more work. If you can, try to get down to two options before you go into the calculations.
How does EMV work?
EMV averages the best and worst case scenarios to give a financial impact. It allows you to take probability into account when working out the potential cost of options so you can compare options to each other and choose the best course of action.
You would use it to:
- Establish which new product option or solution is best
- Establish the contingency reserve required to offset project risk.
What is the EMV formula?
The EMV formula is:
EMV = Probability x Impact
Where Probability is a percentage or fraction and impact (of the risk) is a positive or negative monetary amount.
The result is the average outcome of what might happen in the future. As you can see, it is an easy formula, which is definitely an advantage for your risk assessments.
What is the Expected Monetary Value of a risk?
You can use the EMV calculation to work out the financial implications of risk management activities. It’s a quantitative risk analysis technique based on the probability of occurrence. The terminology is the same as risk management language:
- Positive values for EMV represent opportunities.
- Negative values for EMV represent threats.
Here’s an example. Let’s say you are the project manager for a farm. The farm is looking for additional sources of income and one of your projects is to set up a cheese-making class for other local farmers and interested hobbyists. There are four risks identified as you can see in the table below. You’ve already worked out the appropriate risk responses.
| Risk | Probability | Impact $ | EMV (Probability x Impact) |
| There is a risk that the cheese-making class will be cancelled due to staff shortage | 25% | -5000 | -1250 |
| There is a risk that the cheese-making class will be over-subscribed | 10% | 5000 | 500 |
| There is a risk that the marketing materials will be late | 50% | -600 | -300 |
| There is a risk that the barn will not be fit for purpose and we have to relocate the class to a more expensive marquee | 25% | -10000 | -2500 |
The risk event that the class is cancelled has an EMV of $1,250. That’s a negative risk, a threat. However, there is a small chance that the class is over-subscribed. The impact of the risk is that you have to put on another date to manage the demand. The EMV of this risk is $500. That’s a positive risk, an opportunity.
Add up the EMV for each risk across the impact matrix. That gives you the contingency fund you should be putting aside for the project. In this case, the 4 risks give a total of -$3,550 so that is the amount to allocate to your risk budget.
Back in the real world, you won’t find all of those uncertain events happening. And if a risk does happen, it costs the full amount to put right, not an arbitrary percentage. Your marquee vendor won’t be too happy if you say you’ve only put $2,500 aside as that’s only a quarter of the price to hire one.
However, the EMV is a sensible ballpark figure for contingency budgets when you are putting together the project’s cost baseline. Document your decision in the project’s decision log.
Tip: Take risk attitude into account when allocating probability and impact, especially if you think the organization is risk averse.
EMV analysis example
Another use for EMV is for decision makers using binary decision trees to assess alternative scenarios.
Here’s a simple example analysis to show you how to calculate EMV in a simple case study. It’s surprisingly easy as the formula is not tricky to apply.
Our farm is looking to diversify even further. It has two options to consider. The team could offer weddings, or they could convert a barn into a children’s play area. They want to use EMV to work out which would be the best option.
The table below shows the options under consideration by the farm team. You can see for each option they know how much investment is required to deliver that option. They have also assessed the demand for that particular option. For each level of demand (high, medium or low) they have calculated the Year 1 revenue forecast. In other words, they know how much income they are forecasting based on demand levels for each option.
So which looks best?
| Option | Investment ($k) | High demand ($k) | Medium demand ($k) | Low demand ($k) |
| Weddings | 50 | 100 | 75 | 40 |
| Children’s play barn | 80 | 140 | 125 | 95 |
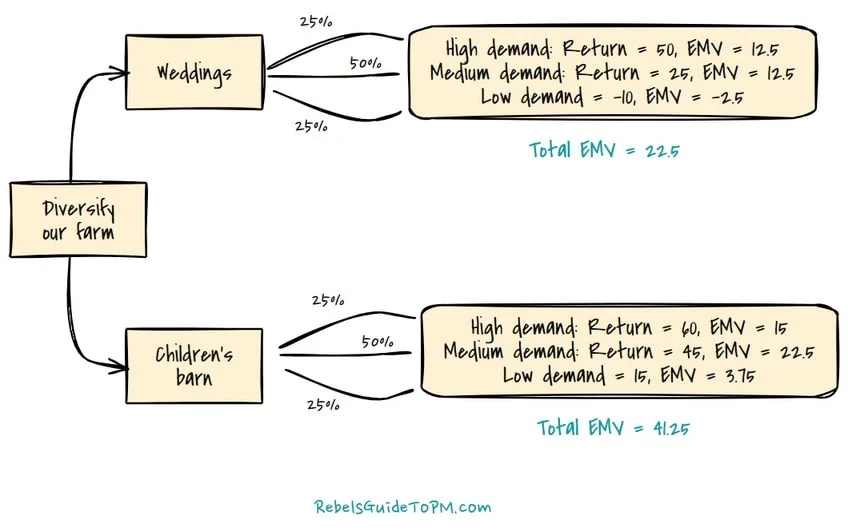
The team takes the data from the table and inputs it into a decision tree. Decision tree analysis helps you see the different options. The decision tree is read from left to right, starting at the decision node that says ‘Diversify our farm’. You can see one below for the choice the farm has to make.

There are several possible outcomes depending on which of the two options the team decides to follow.
For each option, we calculate it by knowing the return, the investment and the probability. Here’s how the project team has broken it down.
Option 1: Weddings
High demand
Return = 100
Investment = 50
The net expected return is 50. The probability of high demand is 25% so the EMV is 25% of 50, which is 0.25 x 50 = 12.5
Medium demand
Return = 75
Investment = 50 (this value doesn’t change: it will always cost the farm $50k to get set up for weddings regardless of what the return or demand is)
The net return in the medium demand scenario is 25. The probability of this being the most likely outcome is 50%. The EMV is 50% of 25, which is 0.5 x 25 = 12.5.
Low demand
Return = 40
Investment = 50
The net return is -10 in year one. In practice, you’d probably be looking at multi-year returns on an investment like this, but for the purposes of our simple example, let’s assume we’re just counting year 1 revenue.
The probability of there being low demand for weddings is 25%. The expected value is 25% of -10, which is -2.5.
Option 2: Children’s barn
High demand
Return = 140
Investment = 80
The net return is 60. The probability of there being high demand for a children’s play barn is 25%, so the EMV is 0.25 x 60 = 15.
Medium demand
Return = 125
Investment = 80 (again, this is the same for all the scenarios)
The net return is 45. With a probability of 50% that gives us 0.5 x 45 = 22.5.
Low demand
Return = 95
Investment = 80
Net return for this option is 15. The probability of low demand for a children’s play barn is 25%, so the simple calculation is 0.25 x 15 = 3.75.
As a decision maker, I’d be looking at the overall EMV of the project. In this case, the children’s barn plan is the best choice as it has the highest EMV. In the worst-case scenario of low demand still provides a positive EMV, which is not the case for offering weddings.
Why do I need to know EMV?
You might be asking yourself why you need to know about EMV. The real answer for project managers is because it might come up in your project management certification exams. For a while it was something considered important to study for the Project Management Professional (
These days, the PMI certification exams spend a lot less time on testing your recall of formulas and a lot more time on scenario-based questions that challenge your understanding of tools, techniques, and practices.
If you are studying for the PMP exam, then I would learn what the EMV results mean. You might get a question that gives you the EMV analysis and asks you to consider what the best course of action would be. So you’d need to know how to interpret the formula. I personally wouldn’t spend any time trying to memorize it (although it is pretty easy!).
This complete self-directed PMP Exam course is our top pick. The Elite PLUS bundle includes the PMP training course, the PMP Exam Simulator, The Formula Guide, and The StudyCoach Guidebook, giving students a PMP Study Plan to follow.
Pros and cons of EMV analysis
Here are some advantages and disadvantages of using EMV as part of your project management process.
Advantages
- EMV uses an easy calculation so the math is simple.
- It is easy to explain to stakeholders.
- It gives you a clear answer, so it helps the decision making process happen without emotion.
- It helps with risk assessment.
- It’s better than a coin flip when it comes to decision making!
Disadvantages
- EMV needs a lot of data – and not just guessing. Reliable input data in will give you a reliable output.
- Risk paths may need more thought and analysis than you are prepared to give.
- It’s easy with only 2 options, but in real life, there are probably more options on the table, and that makes the decision tree complicated.
- It is hard to apply to all types of projects. Where you don’t have financial information associated with risks or alternative scenarios, then it doesn’t add much to the decision-making process.
EMV allows you to weigh up the probability of each outcome and the possible consequences. As risk management techniques go, it’s a good one for situations where you have to make decisions and want a way of weighing up the options.

In summary…
Comparing EMV for various scenarios helps teams choose the best option, where ‘best’ most likely means ‘highest financial return’. It provides data-driven results for decision making.
However, will you ever use EMV in real life? It depends on your project. I can’t say that I’ve ever used it because the kinds of projects I have worked on have not warranted it.
It’s a good, straightforward technique and if you have the data, why not use it? If you don’t have the data, or can’t get the data, or your scenarios don’t fit because you don’t judge things purely in money terms, then you can probably find some better ways of making a decision about what to do.
Read next: Decision making techniques for groups

