Bridge24 Software Review
Read our review guidelines.

Bridge24 provides advanced reporting and exporting capabilities for Asana, Trello, Basecamp and AceProject. This is a review of the product using my desktop and Firefox browser, in August 2019, with the Asana connector.
Bridge24: Overview
Name: Bridge24
Vendor: Websystems, Inc.
Hosting options: Online only + you need an Asana, Trello, Basecamp or AceProject account. (AceProject is also a Websystems, Inc software product.)
Cost and plans: There’s a full free trial for 7 days. Per user pricing starts at $12 per month and decreases the more users you have. It’s even cheaper if you pay annually.
Languages: English, French, Spanish.
What Bridge24 is for
Asana, Trello, Basecamp, AceProject… these are all great tools. Why do you need to use (and pay for) an additional product on top of those?
Well, if you’ve used Asana or Trello for project management, you’ll know that it’s not that easy to get “management” information out of those tools.
What’s great is that you can have multiple teams, using different products, and Bridge24 gives you a common view to look at them all in a standard way.
Solving the Asana export problem: Taking Asana further with Bridge24
I tested Bridge24 with Asana.
There are predefined filters on the left panel menu.

These let you quickly see the tasks assigned to you, or your team. The panel also has tags and projects: click on those to see the data you’ve categorised with tags or specific to a project. You can create your own filters too.
The default view in the main dashboard is the grid view. This is a simple spreadsheet-like list of tasks. You can move the column headers to the order you require, you can sort order the content of columns, and add new columns. You can group by columns by clicking the column header, and also add subgroups, much like pivot tables in Excel. The results can be saved as different views.
I found it far more flexible than Asana. However, if you want to see the task in Asana at any time, simply click the task and choose ‘open in Asana’. You’ll be taken straight there.
Working with Tasks in Bridge24
There is a calendar view, and you can modify dates directly in the calendar by drag and drop the end date. It automatically updates Asana. Click any task from any view and edit the task.
You can also add new tasks direct from the calendar view. Click into any date and it opens up the New Task pane, as you can see from the picture below. Then you can add the details for the task, and select the project from the drop down list.
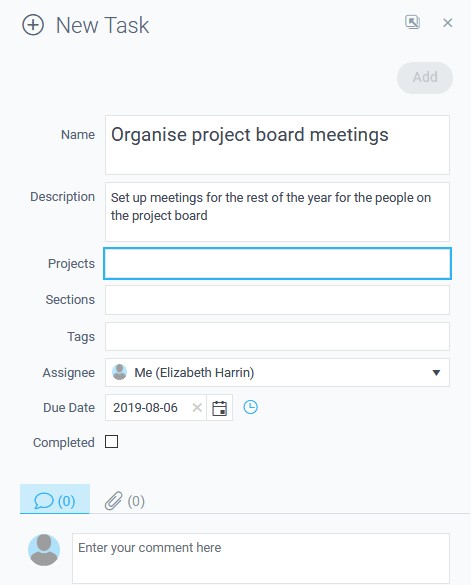
Tasks can also have attachments, comments, custom fields and sub-tasks.
Charts and Graphs in Bridge24
If you’ve tried an Asana export to Excel you’ll know that the options are limited. And yet, we use Excel to create most of the charts and graphs I use for project reporting, especially around costs and time.
The good news is that Bridge24 can do it all for you! There is a suite of interactive reports including:
Pie charts
Doughnut charts (the round ones that are a bit like pie charts)
Polar charts
And horizontal and vertical bar charts.
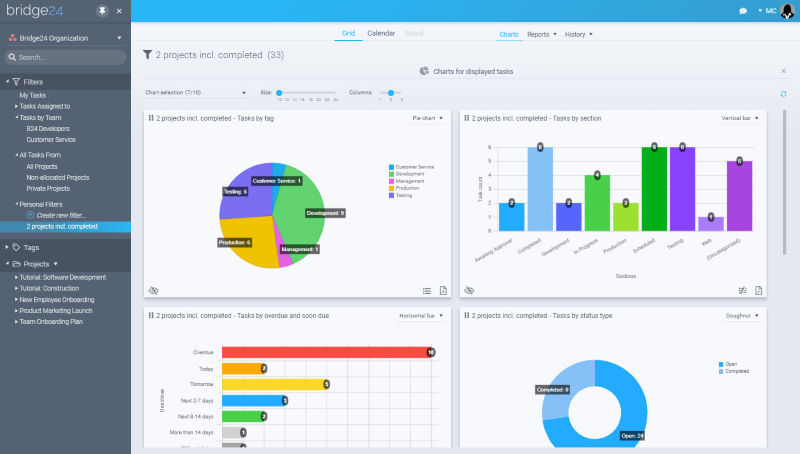
And what, you ask, can I use to create these graphs? Pretty much any variable. You can chart work by assignee, status, section, tasks completed by or created by dates, and even tasks overdue or due soon. There are enough options to satisfy even the most data hungry project sponsor. I like the option to graph by tag, so you can tag anything you like and then hang a chart on that, so you can create a really bespoke chart.
The legend is dynamic, and each chart has parameters that toggle on and off, making it easy to get a quick visual on whatever you want to see.
The other feature you get in Bridge24 that I find tricky to do in Excel is chart stacking. You can display two variables in the same chart.
Even better, the graphs are interactive so you click on a segment and it shows you the underlying data! Great for when someone says, “What does that relate to again?” and you created the chart a month ago and can’t remember.
You can share the graphs with people without Asana/Bridge24 access easily. Save your charts to PDF and you can also export the associated task lists as well so you get the detail and the picture – perfect for communicating to all levels of your project stakeholder community.
This video gives you a quick overview of how easy it is to create a dynamic chart in Bridge24.
Calendar view
The calendar view in Bridge24 isn’t as pretty as the calendar in Asana, but it’s perfectly functional. And perhaps you can make it prettier with colours and pictures of people’s faces like Asana has. Frankly, that kind of detailing doesn’t matter much to me, and I think many project managers would agree. Cut the clutter, and give us what we need to do the job.

Adding emojis to my task names? Yep, that’s definitely something I’m going to start doing from now on!
Tracking What’s Happened
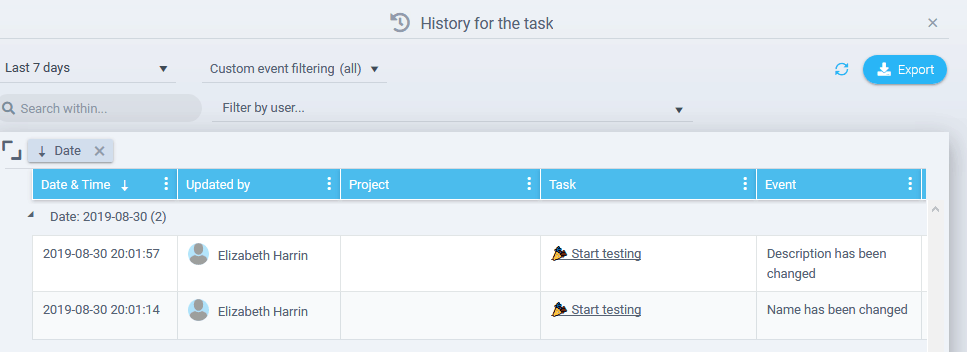
One neat feature of Bridge24 software is that it shows you the task history. There’s an icon in the Actions column on the Grid view that lets you pull up who changed the task and what was done to it. This is huge – it means you can track who has changed what.
When you have one project selected on the filter, you have the board view. You can see the Kanban board, edit, and drag and drop.
From a project or a filter you can create charts. They are predefined but you can drag and drop the order, change whether the legend displays and drill down into the data, you can edit from the graph. The charts can be exported as a PDF with the tasks below.
Export Asana data
Reporting and exporting is where Bridge24 has real strength. You can’t currently export directly to Excel from Asana (although you can create .csv files). Bridge24 removes that constraint. With the Bridge24 Asana export add-on, you can easily get reports that look good, and export to Excel and PDF.
There are two types of report in Bridge24: simple reports and advanced task reports.
Simple reports are basically a list of tasks – and there are scenarios on projects where you would want that. For example, giving a team member a print out or spreadsheet of the work that is allocated to them.
Advanced reports give you more information and they allow you to select two different fields to report by, for example, the project section and team assignment. You can edit 4 extra columns to add into the report. You get much more data and it displays nicely, which is always important if you are going to be sharing the reports with executives.
At any time you can export information – however, make sure the view is as you want it before you export. You can also set parameters for export to Excel, so that saves time.
Help
I always like to check out what help options there are. I tend to dive straight in to using software, but when you get stuck on something it’s good to know there is help available.
Bridge24 has a walkthrough tutorial when you first login, and I found that helpful and not intrusive. There are also videos in the Help section of the website and there’s an online chat. I tested that, and it felt like I was talking to a real person, not an auto bot, so that gave me confidence. Plus, the agent came into the chat really quickly for 8pm on a Friday night!

Summary
Bridge24 is straightforward to use, and adds massive power to the tools you already have. If you think of it as a mega add-on instead of a tool in its own right, you can see how it extends and improves on the solutions your team is already using.
While I’ve looked at it with Asana, it works in the same way with the other tools. So if you want Trello exports, for example, you can use Bridge24 to be your ‘bridge’.
Bridge24 is great for Asana, Trello, Basecamp and AceProject users, especially those who need to be able to do structured reporting for the project office or PMO. Because being able to get your data out of your tools is just as important as being able to use the data when it’s in there.
Pin for later reading:
