What should a project timeline include?
A project timeline is a visual representation of the tasks that make up the project, showing the sequence of events and key dates.
Let’s be clear: I’m not talking about a detailed project Gantt chart, PERT chart or a flow chart. I’m talking about a lovely, professional looking slide (or slide-shaped screen) that shows the project activity in chronological order. You might know it as a plan on a page (POAP).
Every governance meeting I go to needs to see the plan on a page. My plan on a page milestones are rolled up into the portfolio plan on a page. Execs love a pretty timeline, and in this article, I’m going to show you what you should be including in yours to wow your stakeholders (and build some credibility at the same time).
What do you need to create a project timeline?
Before you can create a project timeline, you’ll need to know some core details about your project.
- Start date: When are you starting the work?
- Key activities: What work is going to happen?
- Duration of key activities: How long will the tasks take?
- Sequence: What order do the activities happen in?
- Milestones: What are the key milestones during the project lifecycle?
If you don’t have at least those basics, you can’t start putting your timeline together.
What if you don’t have a start date?
I’ve worked on projects where we have had to put together a timeline but with no fixed start date. That’s OK, it’s doable. Instead of using specific dates, use ‘Month 1’, ‘Month 2’ (or ‘Week 1’ etc) across the top.
Then whenever the work starts, the timeline is still true, and you can switch out the placeholder ‘Month 1’ titles with the actual months.
What if I don’t want to show the entire project?
You don’t have to show the entire project as a horizontal chart. A project management timeline is a communication tool so if you want to communicate about the plans for training, just do a slide showing that.
Make it clear that the timeline people are looking at only shows a portion of the project.
What makes an effective timeline?
An effective timeline is one that gets the message across quickly and easily.
It’s a visual overview of the work done and to do. If your timeline communicates the key activities that enable you to complete the project deliverables and achieve the benefits, then it has done its job.
Items to include in the project timeline
As a minimum, your timeline should include these key elements:
- Start dates and finish dates
- Activities in the right sequence
That’s it. But you can make your timeline a lot more useful by including more things on it. Below, we’ll look at the features you can include in the timeline to showcase exactly what your project is doing.
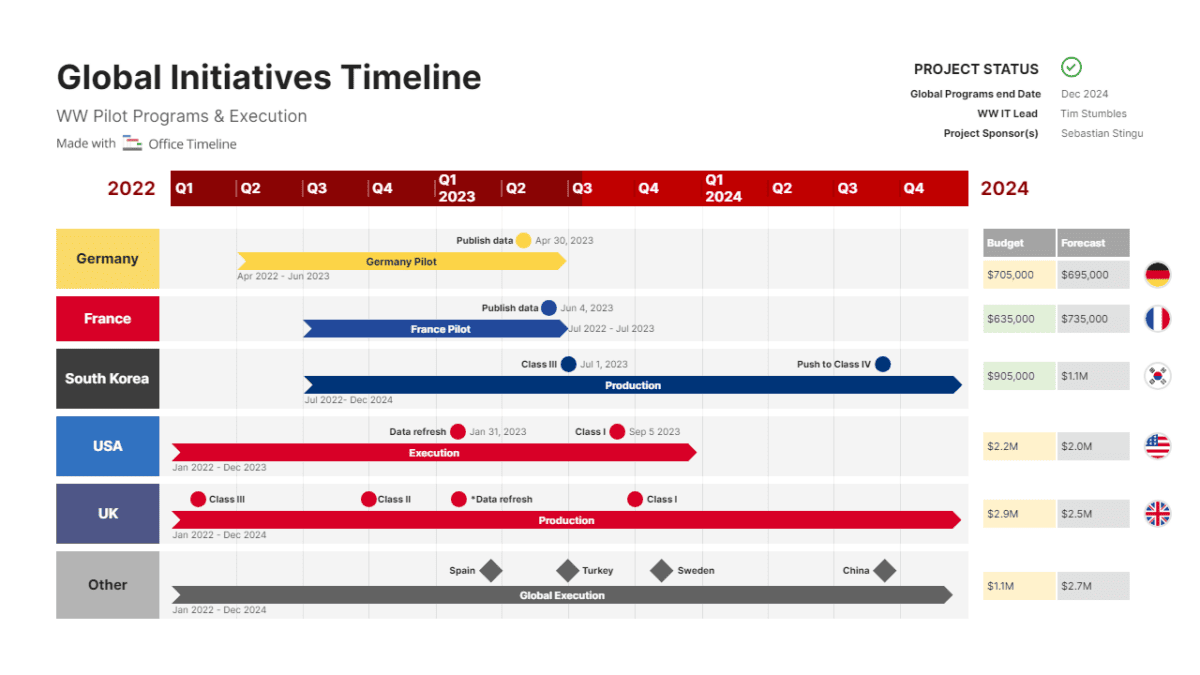
Date bar
The dates go across the top of your timeline to show linear progression throughout the month, quarter or year.
Choose a time period or interval that works best for you. If my project is only 3 months long, I would choose to display intervals in weeks. Longer projects can be split by quarters.
You can have more than one date bar. For longer projects, you could have a bar across the top showing the quarter and then another one showing the breakdown by month, so play around with what looks good to you.
If you use rolling wave planning, you might have your date columns showing months or quarters, and then a final section at the end for the next time period — where you haven’t got a lot of detail yet but want to represent that the project still continues into the future.
Task bars
You can’t have a timeline without tasks!
A timeline is different to a Gantt chart, as it is a tool for communication and a high-level view of the project. Gantt charts can stretch to hundreds of lines with detailed dependencies, task owner names, various different dates depending on early or late start, float and more. That’s too much for a timeline.
The point of a timeline is to share the overall journey of the project, so think about what tasks you need to show to do that (and it won’t be your entire project schedule).
These tasks would work well on a timeline:
- Supplier selection
- Plan
- Build
- Testing
- Training
- Rollout
Take your overall list of tasks and group them or roll them up to give you the level of detailed needed. Stick to high level activities, not individual tasks that only last a couple of days or that are a specialist task that needs explaining.
More free PowerPoint templates
Project status update timeline
Executive timeline update
Project Ganttchart template
Annual project timeline
Durations and dates
Task bars are useful, but the question I get asked the most is ‘when is that happening?’ As a project manager, it’s also what I want to know from workstream leads.
Clarify your timeline by adding extra text that spells out key dates or the duration of tasks. Then people won’t be trying to count up how many weeks the rollout is because it’s right there spelled out for them.
Workstreams/swimlanes
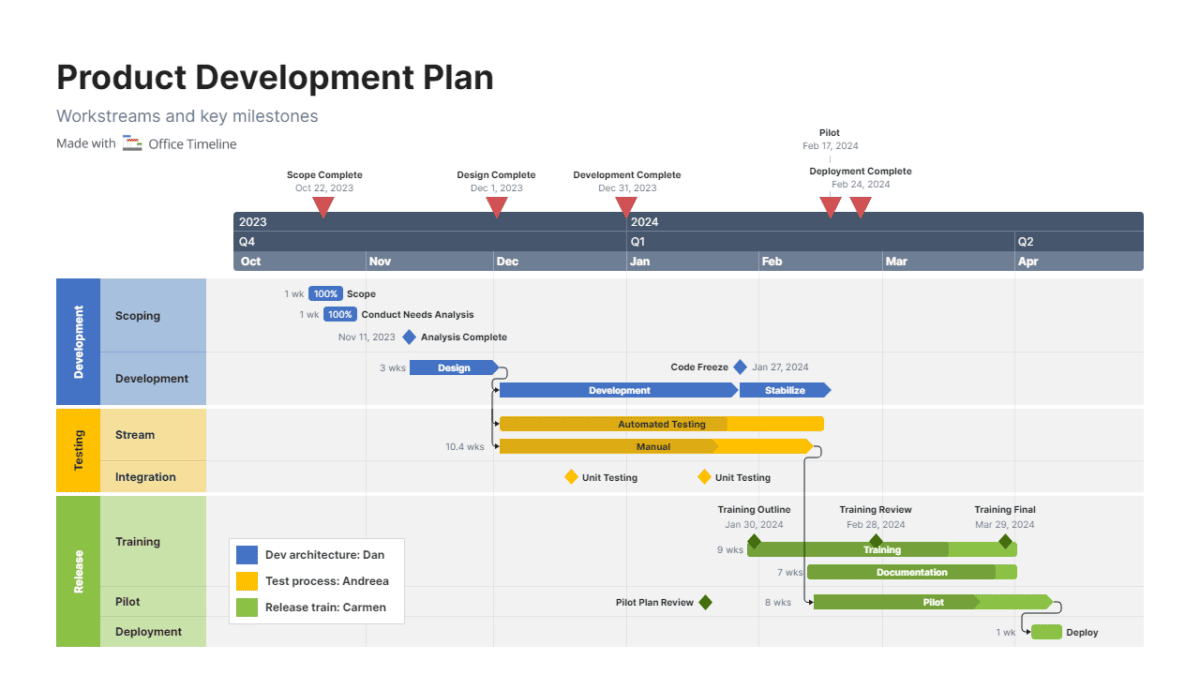
Most of my projects have workstreams or various teams being responsible for different things. The great thing about a timeline is that you can visually split the work into swimlanes that can be color-coded. You can see at a glance who is doing what.
For example, in the image below you can see there are 3 major swimlanes: Development, Testing and Release. Each of these is split into further sub-swimlanes. Development is split into scoping and development.
You could also split by project phase, the department responsible for the work or anything else that makes sense to you.
Breakdown your timeline into logical chunks using multi-level swimlanes so people can quickly understand how the work progresses through the project.
Milestones
Milestones are specific points in a project that represent a decision or marker. They are added to a plan but they have the duration of zero days – they are not a task.
Examples of milestones include:
- Business case submitted
- Approval from board
- Gate reviews and other governance points
- Testing complete
- Training material sign off (any sign off point)
Go through your project deliverables and see if any completion dates or sign off dates can be added as milestones. Again, keep it high level, you don’t need to copy every milestone from the schedule.
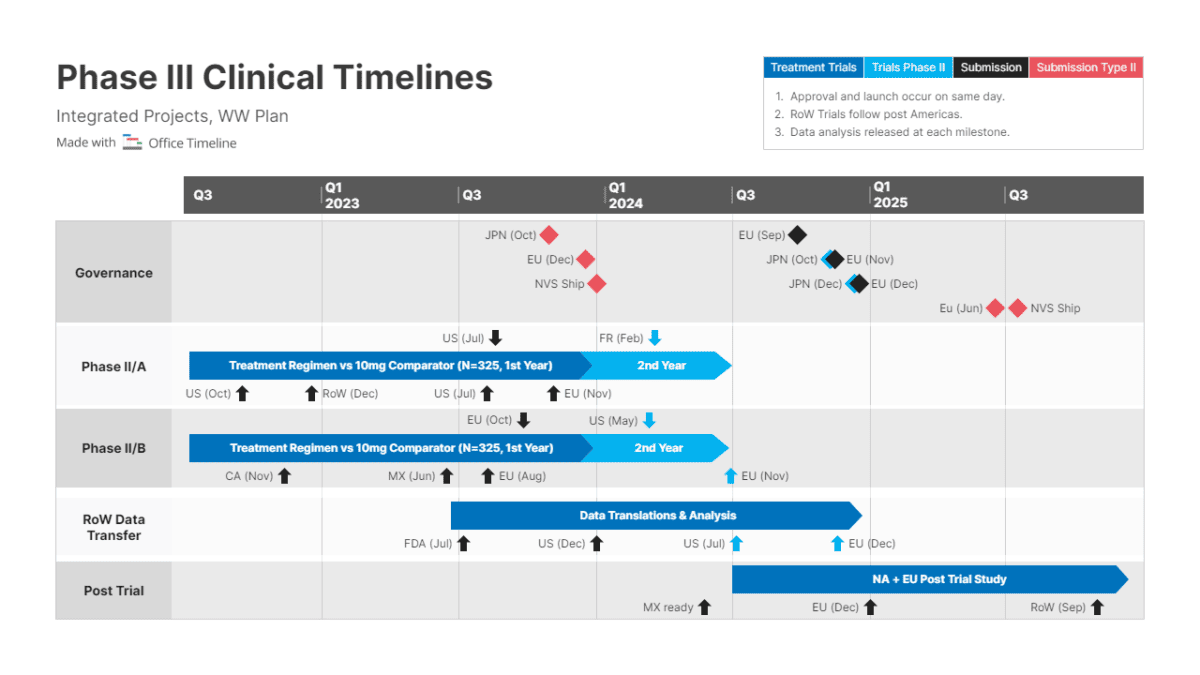
On a Gantt chart, you’ll see milestones represented as a black diamond shape. On a timeline, you have the creative freedom to use pretty much any shape you like! We use colored circles on our timelines. You can use triangles, flags or whatever.
Color-code milestones to show if they are completed (blue), on track (green), at risk (amber/yellow) or missed/high risk (red). If you recognize these colors, it’s because they are the same as what we use to represent project status for RAG reporting.
‘Today’ marker
Add a vertical line down the page to mark ‘today’ on your timeline. This shows project progress.
I like using a marker that represents today as it helps people understand how much actual progress has been made against what was planned and what is still to come. It helps give a ‘real time’ feel to the work.
Tip!
Remember to update the ‘today’ line each time you show your document to someone! I’ve been caught out where I’ve put a timeline slide on the screen and all the tasks and milestones are accurate but the ‘today’ line still shows as last month.
Gridlines
Add lines to the grid to help draw people’s attention to the months or weeks. You don’t have to use gridlines, but I think they are useful when the timeline looks busy, because they help provide a visual frame of reference to understand what you are looking at.
Legend
Add a legend in the corner of your timeline if you have used different colors to mean different things.
Title
Don’t forget the title! Leave space on the page for a descriptive title and subtitle that explains what readers are looking at.
Colors and branding
People can tell if you’ve used the default PowerPoint colors or the palette that comes out of the box with your project timeline software.
Switch out the defaults to your organization’s brand colors and fonts. Add some design elements that make it look like it’s part of the standard PowerPoint deck.
What not to include
There are lots of things you can include in a timeline, but what should you avoid putting in? Here are some items I would steer clear of.
Dependencies between tasks
Remember, your plan on a page is a high level summary so it’s not necessary to mark up relationships between tasks. Unless it’s really important, don’t add lines or arrows to dependent tasks – it’s just going to look messy.
Flag interdependent tasks – especially if the dependency is coming in from another project – with a call out box or some text instead.
Task progress
OK, you could color in the bar chart lines to show task progress as a representation of percent complete, but that’s a lot of additional work and more lines to keep up to date.
Stick with the high level approach. If an activity is running behind, you can change the color of the whole bar, or just move it to the new expected delivery date (as long as you have had approval to update the baseline).
Task owners
You can use swimlanes to designate activities to a department, but I wouldn’t add the detail of each individual task owner. Does your project sponsor really need to know that Claire is doing that task?
If you have stuck to the principle of keeping things high level, most ‘tasks’ will be worked on by several people in the project team anyway because the bars will represent a group of activities.
Resource availability
Flag issues with resource in a different way. The timeline is to show key stakeholders and project leaders what is happening when.
If you have issues with resources being available, turn your milestones amber or red and use your risk management process to flag that there isn’t anyone available to do the work.
The jury is out on the critical path…
I personally don’t add the critical path to my timeline. As the overall look of the plan on a page slide is clean, I don’t want to mess that up with extra lines.
Also, the critical path might not be super clear anyway as grouped activities are not at a granular level. Probably your whole timeline is the critical path!
Use Gantt chart software with critical path method features built in if you want to identify the critical path. Then pick out key points on the project schedule that are on the critical path and add milestones to your timeline that highlight these crucial times.
Project management tools for timelines
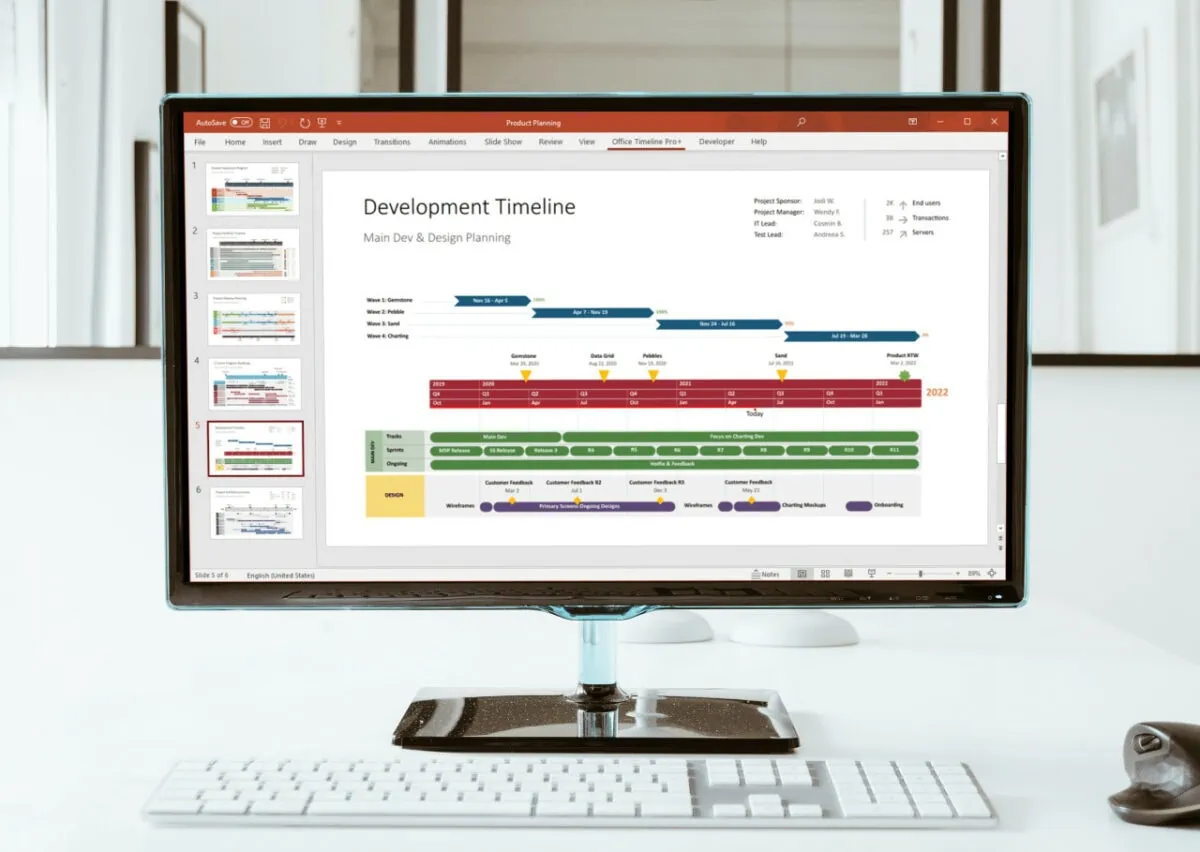
The tool I recommend for timelines specifically is Office Timeline. Most of my stakeholders want to see plans in PowerPoint, and Office Timeline’s plugin give you exactly that, with loads of customizable features.
Yes, you can create a timeline from scratch in PowerPoint, but why would you when you can get timeline templates ready done? You can start with a ready-made template, sync it with your data, and quickly adjust the layout or styling as needed. This saves so much time and ensures you have all the necessary components described above.
Next steps
Ready to create a timeline?
Remember, yours doesn’t have to look the same as mine. If you want to add extra features because it helps with comprehension or your project leaders have asked for it, then do.
Start with Office Timeline’s free 14-day trial and see what it can do. The PowerPoint plugin creates a slide that you can edit to your heart’s content using the drag-and-drop overlay. And when it’s time to update the plan, you can easily bring in your new data via the Refresh option.
Share your timeline with the project team. Get it approved if necessary, and then show it off to as many stakeholders as you can!
Featured Software Partners
Create impressive timelines in just a few clicks with this plugin for PowerPoint. Try Office Timeline Pro+ free for 14 days. Create beautiful timelines and Gantt charts right in PowerPoint. Perfect for your next stakeholder presentation!
A great tool for organizing all our work, schedules and task allocations in the team. We wouldn't be without it!
Get fast & free advice from the experts at Crozdesk.com. Crozdesk's small team of dedicated Project Management software enthusiasts will compare 360+ products for you. Tell them your requirements and they'll match you with the right expert who can help.
- No Obligations
- Free Service
- Exclusive Discounts
- Expert Advice
- Minimal Time Commitment
- Get a Custom Comparison Report
